Beer and Lambert’s Law is a fundamental principle in spectroscopy that relates the absorption of light by a medium to its concentration and path length. It is widely used in analytical chemistry, physics, and biochemistry to quantify the concentration of analytes in solution.
Statement of Beer-Lambert Law
The law states:
A = ϵ ⋅ c ⋅ l
Where:
(A): Absorbance (no unit, dimensionless).
(ϵ): Molar absorptivity (L·mol-1·cm-1).
(c): Concentration of the absorbing species (L·mol-1).
(l): Path length of the medium through which light passes (cm).
The Beer-Lambert law can also be expressed in terms of transmittance (T) and absorbance (A):
A = −log10 (T)
Where:
(T): Transmittance (dimensionless).
(I): Intensity of transmitted light.
(I0): Intensity of incident light.
Derivation of Beer-Lambert Law
The Beer-Lambert Law is derived by combining two separate laws:
(A) Lambert’s Law
Statement: The absorption of light is proportional to the thickness (dx) of the medium.
Expression:
dI =−k ⋅ I ⋅ dx
Where (k) is the absorption coefficient.
Integration:
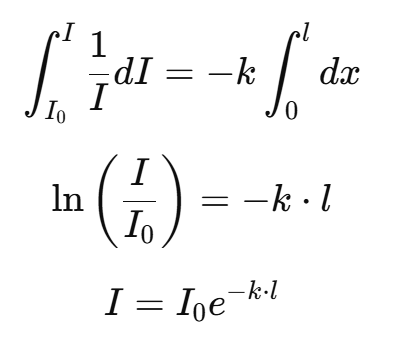
(B) Beer’s Law
Statement: The absorption of light is proportional to the concentration (c) of the absorbing species in the medium.
Incorporation into Lambert’s Law:
k = ϵ ⋅ c
Substituting into Lambert’s equation:
I = I0e−ϵ⋅c⋅l
Taking logarithms:
A = −log10 (T) = ϵ ⋅ c ⋅ l
Limitations and Deviations from Beer-Lambert Law
The Beer-Lambert law assumes ideal conditions. However, deviations occur due to various reasons:
(A) Instrumental Deviations
1. Stray Light:
- Light scattering or reflection from optical components leads to errors.
- Affects low-transmittance (high-absorbance) measurements.
2. Polychromatic Light:
- Assumes monochromatic light, but real light sources often emit a range of wavelengths.
- Each wavelength has a different (ϵ), leading to non-linearity.
3. Detector Non-Linearity:
Imperfections in detectors can cause inaccurate measurements of (I) and (I0).
(B) Chemical Deviations
1. Dissociation/Association:
Analyte may dissociate or associate in solution, altering the concentration of the absorbing species.
Example: Acids and bases in aqueous solutions.
2. Chemical Reactions:
The analyte may react with the solvent or other substances.
Example: Keto-enol tautomerization.
3. Non-Specific Interactions:
Intermolecular interactions such as hydrogen bonding or complexation can change ϵ.
(C) Physical Deviations
1. High Concentration Effects: At high concentrations, solute molecules may aggregate or interact, altering the effective molar absorptivity. Causes deviations from linearity in (A) vs. (c).
2. Refractive Index: Changes in refractive index with concentration can affect light path and intensity.
(D) Path Length Deviations
Assumes uniform path length (l), but in practical scenarios, irregularities in the cuvette may cause deviations.
Experimental Conditions to Minimize Deviations
- Use dilute solutions to avoid molecular interactions.
- Employ monochromatic light or narrow-band filters.
- Calibrate instruments regularly to correct for stray light and detector issues.
- Maintain consistent and accurate path length using high-quality cuvettes.
- Use solvents that do not react with the analyte.
Applications of Beer-Lambert Law
(A) Quantitative Analysis Determining the concentration of a substance in a solution (e.g., drug assay in pharmaceuticals).
(B) Spectroscopic Techniques Used in UV-Vis and IR spectroscopy for structural and compositional analysis.
(C) Biochemistry Quantification of nucleic acids and proteins (e.g., DNA absorbance at 260 nm, protein absorbance at 280 nm).
(D) Environmental Monitoring Analysis of pollutants in water and air.
(E) Industrial Applications Quality control in the production of dyes, food additives, and chemicals.
Conclusion
The Beer-Lambert law provides a robust theoretical framework for understanding and quantifying light absorption in a medium. However, its applicability depends on maintaining ideal conditions and recognizing possible deviations. Understanding these deviations and their causes is essential for accurate spectroscopic measurements and reliable data interpretation.