Dose-Response Relationship
The dose-response relationship is one of the most important and foundational principles in pharmacology, toxicology, and medicine. It helps us understand how a drug, chemical, or toxin affects the body depending on how much of it is taken. In other words, it explains “what happens to the body when we increase or decrease the dose of a substance.”
This concept is not only crucial for scientists who develop new drugs, but also for doctors who prescribe medications and for toxicologists who study the safety of chemicals.
Key Concepts:
Dose: The amount of a substance an organism is exposed to, often expressed in milligrams (mg) per kilogram (kg) of body weight or parts per million (ppm) in the environment.
Response: The measurable effect of the substance on the organism, which can be beneficial (e.g., pain relief from a drug) or detrimental (e.g., poisoning).
Dose-Response Curve: A graphical representation of the dose-response relationship. It typically plots the dose on the x-axis and the response on the y-axis.
What is a Dose-Response Relationship?
The dose-response relationship refers to the relationship between the amount (dose) of a substance and the effect (response) it produces in a living system. When we take a small dose of a drug, it may have no effect, a mild effect, or a full effect. As the dose increases, the effect also increases—up to a certain point.
This relationship can be shown as a graph, with the dose on the x-axis (horizontal) and the response on the y-axis (vertical). Typically, this graph looks like an S-shaped curve or sigmoid curve.
Why is This Important?
Understanding the dose-response relationship helps us answer many important questions:
- How much of a drug is needed to work?
- At what dose does a drug become dangerous or toxic?
- What is the safest and most effective dose to give to patients?
By studying this relationship, we can find out the right balance between effectiveness and safety.
Types of Dose-Response Relationships
There are mainly two types of dose-response relationships:
1. Graded Dose-Response Relationship
This type occurs in individual organisms. The response changes in magnitude (how strong it is) as the dose increases.
Example:
Let’s say a person takes paracetamol (also known as acetaminophen) for fever.
- At 100 mg – No effect
- At 500 mg – Slight decrease in fever
- At 1000 mg – Significant decrease in fever
The more the dose, the stronger the response, until a maximum effect is reached. After that, increasing the dose won’t increase the response and may only cause side effects.
2. Quantal Dose-Response Relationship
This type occurs in populations, not individuals. It shows the number or percentage of individuals who show a specific response at each dose. The response is “all-or-nothing” (yes or no), not a gradual increase.
Example:
In a group of 100 mice exposed to a poison:
- At 1 mg – 0% die
- At 5 mg – 20% die
- At 10 mg – 50% die (LD₅₀)
- At 15 mg – 90% die
This helps us determine the lethal dose 50 (LD₅₀), which is the dose that causes death in 50% of the population.
Important Terms in Dose-Response Studies
To understand this topic fully, you should know some key terms:
1. Threshold Dose: This is the lowest dose at which a response or effect can be seen. Below this dose, the body may not show any noticeable effect.
2. ED₅₀ (Effective Dose 50): This is the dose that causes 50% of the maximum effect in an individual or produces a specific effect in 50% of a population.
3. TD₅₀ (Toxic Dose 50): This is the dose that produces toxic (harmful) effects in 50% of the population.
4. LD₅₀ (Lethal Dose 50): This is the dose that causes death in 50% of the population. It is commonly used in animal studies to measure acute toxicity.
5. Potenc: Potency refers to how strong a drug is. A more potent drug needs a lower dose to produce the same effect compared to a less potent drug.
Example:
- Drug A produces pain relief at 5 mg.
- Drug B produces the same pain relief at 50 mg.
Drug A is more potent.
6. Efficacy: Efficacy is the maximum effect a drug can produce, regardless of dose. A drug with high efficacy produces a greater response than a drug with low efficacy.
Phases of the Dose-Response Curve
A typical dose-response curve has three phases:
1. Lag Phase (No Response Zone): In the beginning, small doses do not produce any effect. This is called the threshold region. At the very beginning of the curve, when small doses are given, the drug may not produce any noticeable effect. This is because the dose is too low to trigger a measurable or physiological response in the body.
Example: Suppose you take 50 mg of paracetamol (acetaminophen) when you have a high fever. You may not feel any better because the dose is too small to lower your body temperature. This falls into the lag phase.
Key Term:
Threshold Dose: The minimum dose at which an effect begins to appear.
2. Linear Phase (Increasing Response): As the dose increases, the response also increases in a fairly straight line. This is the most useful part of the curve and is used to compare drug potency. Once the threshold is crossed, the response increases in proportion to the dose. This means that if you double the dose, the response roughly doubles too (at least over a certain range). This part of the curve is usually a straightline or slightly curved.
Example: If you increase your paracetamol dose from 250 mg to 500 mg, and then to 1000 mg, you may feel the fever gradually going down. You’re now in the linear phase, where each increase in dose gives you a better effect (to a limit).
3. Plateau Phase (Maximal Response): Eventually, increasing the dose further does not increase the effect. The response has reached its maximum level. Giving more of the drug may only increase side effects or toxicity.
After a certain point, increasing the dose further does not increase the effect. This is because:
- All receptors are already occupied.
- The body cannot respond any more than it already is.
- You have reached the maximum possible effect of the drug.
Increasing the dose beyond this point won’t help, but it may increase side effects or toxicity. The curve flattens here.
Example: Taking 1500 mg of paracetamol might not reduce fever any better than 1000 mg, but it can increase the risk of liver damage. You’re in the plateau phase, where effectiveness stops increasing but toxicity starts to become more likely.
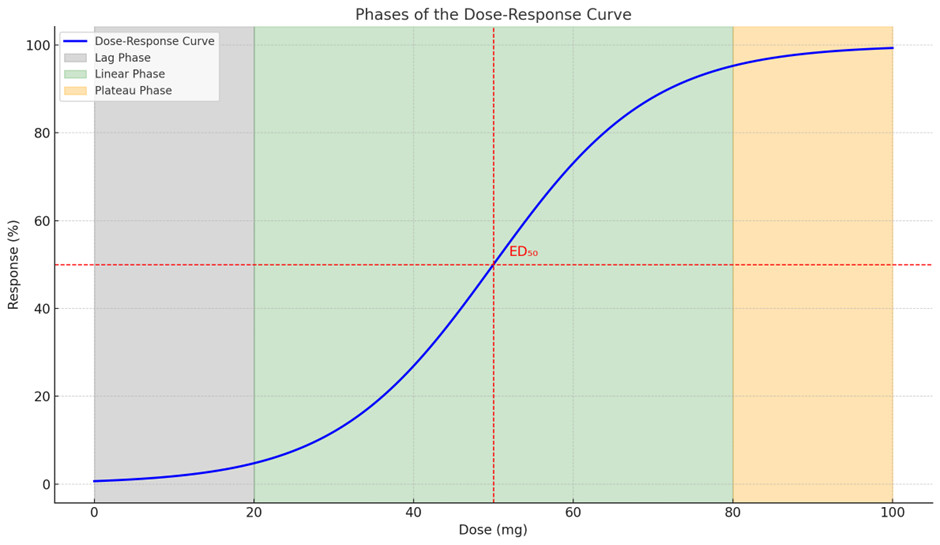
Dose-Response Curve highlighting the three distinct phases:
Gray (Lag Phase): Low doses show little to no effect.
Green (Linear Phase): Response increases proportionally with dose.
Orange (Plateau Phase): Maximum effect is reached; higher doses won’t improve the response and may increase toxicity.
The red dashed lines mark the ED₅₀ (Effective Dose for 50% response), a key point used to compare drug potency.
Applications of Dose-Response Relationship
The dose-response concept is widely used in:
1. Drug Development: Scientists use it to find the right dose for maximum benefit and minimal side effects.
2. Toxicology: It helps in determining safe exposure limits for chemicals and environmental toxins.
3. Clinical Practice: Doctors adjust doses based on individual responses to avoid toxicity and ensure the desired therapeutic effect.
4. Regulatory Agencies: Organizations like the FDA, EPA, and WHO use this data to approve drugs and set safety standards.
Other Concepts in Dose-Response
1. Hormesis
Sometimes, very low doses of a toxin may actually have beneficial effects, while high doses are harmful. This is called hormesis.
2. Tolerance and Sensitization
- Tolerance: When repeated use of a drug makes it less effective (e.g., opioids).
- Sensitization: When the drug becomes more effective after repeated use.
3. Individual Variability
Not all people respond the same way to the same dose. Factors like age, gender, genetics, liver function, kidney function, and other medications can influence response.
Conclusion
The dose-response relationship is a cornerstone in the study of drugs, chemicals, and poisons. It helps us understand how much of a substance is needed to cause an effect, whether it’s beneficial or harmful. This understanding is essential for:
- Choosing the right dose,
- Avoiding toxicity,
- Developing safe and effective medications,
- And ensuring better patient care.
By looking at how a drug behaves at different doses, we can make smart and informed decisions in both medicine and public health.