
1. Definition of Correlation
Karl Pearsons Coefficient of Correlation: Correlation is a statistical technique used to measure and describe the strength and direction of a relationship between two quantitative variables. It helps determine whether, and to what degree, a change in one variable is associated with a change in another.

In simpler terms, correlation answers the question: “When one variable changes, does the other tend to change as well—and if so, how strongly and in which direction?”
Correlation can be positive, negative, or zero:
- A positive correlation indicates that as one variable increases, the other also increases.
- A negative correlation indicates that as one variable increases, the other decreases.
- A zero correlation means there is no linear relationship between the variables.
Correlation does not imply causation. That is, just because two variables are correlated does not mean one causes the other.
2. Karl Pearsons Coefficient of Correlation
Definition and Formula:
Karl Pearson’s coefficient of correlation (commonly denoted as r) is the most widely used method to quantify the linear relationship between two continuous variables. It provides a numerical value ranging from -1 to +1, indicating the direction and strength of the correlation.
The formula for Karl Pearson’s correlation coefficient is:
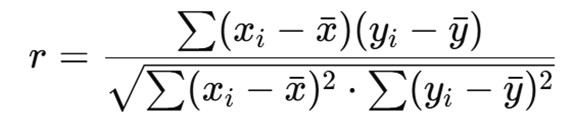
Where:
- Xi and yi are the individual sample points
- xˉbar is the mean of the x-values
- yˉbar is the mean of the y-values
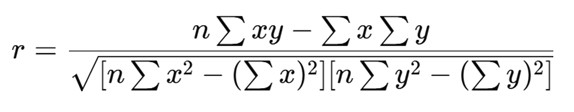
Alternatively, for computational ease, this formula can also be used:
Interpretation of r values:
| r Value | Interpretation |
| +1 | Perfect positive correlation |
| 0 to +0.75 | Moderate to strong positive |
| 0 | No linear correlation |
| -0.75 to 0 | Moderate to strong negative |
| -1 | Perfect negative correlation |
3. Pharmaceutical Examples of Correlation
Example 1: Correlation Between Dose and Therapeutic Response
A pharmacologist investigates the relationship between the dose of a drug (in mg) and the corresponding reduction in systolic blood pressure (in mmHg) in five patients.
| Dose (mg) | Reduction in SBP (mmHg) |
| 50 | 8 |
| 100 | 14 |
| 150 | 20 |
| 200 | 25 |
| 250 | 30 |
From this dataset, it is evident that as the dose increases, the reduction in blood pressure also increases. A Pearson correlation coefficient (r) calculated here would likely be close to +1, indicating a strong positive correlation.
This helps establish that higher doses are linearly associated with greater therapeutic responses—useful for dose-response studies and Phase II clinical trials.
Example 2: Correlation Between Plasma Drug Concentration and Adverse Effects
Suppose a pharmacovigilance team analyzes plasma concentration of a drug (in µg/mL) and the intensity of adverse drug reactions (scored from 1 to 10).
| Plasma Conc. (µg/mL) | ADR Score |
| 5 | 2 |
| 10 | 3 |
| 15 | 5 |
| 20 | 7 |
| 25 | 9 |
Again, the pattern shows that as the drug concentration increases, adverse reactions become more intense. Calculating r in this example would likely result in a value close to +0.95 to +1, demonstrating a very strong positive correlation. This type of analysis helps define therapeutic windows and toxic levels for safer prescribing.
Example 3: Negative Correlation – Patient Compliance and Number of Tablets per Day
A pharmaceutical company studies the relationship between the number of tablets a patient must take per day and patient compliance (measured as the percentage of doses taken as prescribed).
| Tablets/Day | Compliance (%) |
| 1 | 95 |
| 2 | 90 |
| 3 | 82 |
| 4 | 75 |
| 5 | 68 |
As the number of tablets increases, the compliance rate decreases, showing a negative correlation. In this case, r might be around -0.98, indicating a strong negative correlation.
This kind of data is critical in pharmaceutical product development where minimizing pill burden (e.g., developing extended-release or combination formulations) can improve adherence.
Example 4: No Correlation – Age and Drug Absorption Rate
In a study of drug absorption rates across age groups, researchers found that there is no consistent trend between age and absorption rate for a specific drug due to compensatory physiological mechanisms. When plotted, the values are scattered randomly. Here, r would be close to 0, indicating no linear correlation.
This finding could be useful to support that dose adjustments may not be necessary solely based on age for that specific drug.
Conclusion
Correlation, especially using Karl Pearson’s coefficient (r), is a vital statistical tool in pharmaceutical research, clinical trials, and healthcare analytics. It allows researchers to evaluate the strength and direction of relationships between variables like dose and response, plasma level and toxicity, or compliance and formulation type.
However, it is crucial to remember that correlation does not imply causation. While correlation can indicate an association, further experimental studies are required to determine cause-effect relationships.
Using correlation analysis wisely helps pharmaceutical scientists and healthcare providers make informed, data-driven decisions to improve drug safety, efficacy, and patient adherence.