
Measures of central tendency are statistical tools used to describe the center or typical value of a dataset. In other words, they help summarize a large set of data into a single value that represents the whole. The three primary measures of central tendency are Mean, Median, and Mode. These measures are crucial in pharmaceutical sciences for interpreting experimental results, clinical data, formulation studies, and quality control.
Understanding these measures allows researchers and healthcare professionals to describe drug responses, dosage levels, patient outcomes, and variability in a population with greater precision and reliability.
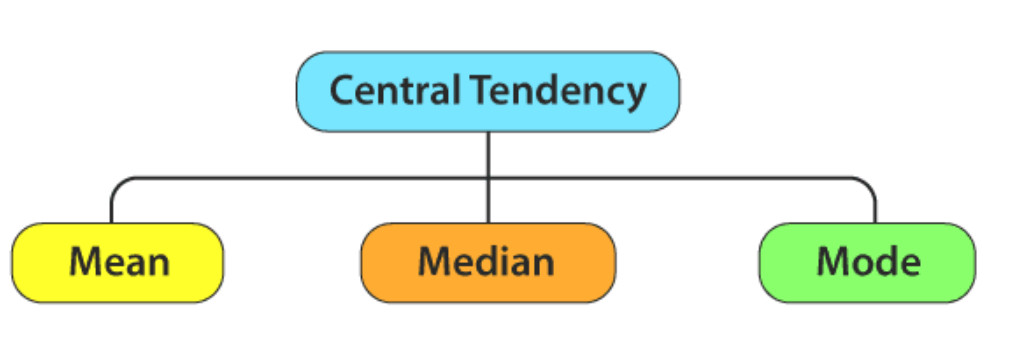
Measures of Central Tendency
1. Mean (Arithmetic Average)
The mean is the sum of all the values in a dataset divided by the total number of values. It is the most commonly used measure of central tendency and is very useful when data is symmetrically distributed and free from outliers.
Mean =
Where:
- ∑x sum x is the sum of all values
- n is the number of observations
Pharmaceutical Example:
Suppose a pharmacist measures the blood glucose levels (in mg/dL) of 5 diabetic patients after administering a new anti-diabetic drug:
Values: 160, 155, 170, 165, 150

Interpretation: The average post-treatment blood glucose level among these patients is 160 mg/dL, which may indicate the efficacy of the drug at that dose.
When to Use:
- Data is continuous and evenly distributed.
- No extreme outliers are present.
- Quantitative analysis such as in dosage formulation and bioavailability studies.
2. Median
The median is the middle value in a dataset when it is arranged in ascending or descending order. If the number of observations is even, the median is the average of the two middle numbers.
The median is less affected by extreme values or skewed data and is thus preferred when outliers are present.
Pharmaceutical Example:
Let’s consider the following data representing the number of adverse drug reactions (ADRs) reported per day over a week:
Values (ordered): 2, 3, 4, 6, 7, 8, 15
There are 7 values, so the median is the 4th value:
Median = 6 ADRs/day
Interpretation: Half of the days had fewer than 6 ADRs reported, and half had more. This gives a central idea of ADR frequency, even though the value 15 is an outlier.
Now, if we had 8 values: 2, 3, 4, 6, 7, 8, 15, 20
Then,
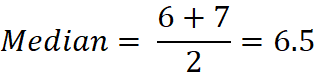
When to Use:
- Data is ordinal or skewed.
- Outliers or extreme values are present.
- Clinical trial outcomes (e.g., median survival time in oncology).
3. Mode
The mode is the value that occurs most frequently in a dataset. Unlike the mean or median, the mode can be used for both numerical and categorical data. There can be:
- Unimodal (one mode),
- Bimodal (two modes),
- Multimodal (more than two modes), or
- No mode (if all values are unique).
Pharmaceutical Example:
Suppose a pharmacist records the most common tablet weight (in mg) produced during a manufacturing run:
Values: 495, 500, 500, 500, 505, 495, 510, 495
In this case, the number 500 appears three times, and 495 also appears three times. So the data is bimodal with modes at 495 mg and 500 mg.
Interpretation: The tablet compression machine is producing tablets mostly around 495 mg and 500 mg, which may suggest the need to adjust settings for consistency.
Another example in pharmacy retail: if the most sold drug in a pharmacy is Paracetamol 500 mg, then Paracetamol 500 mg is the modal value in the dataset of drug sales.
When to Use:
- To identify the most frequent observation.
- Suitable for categorical data (e.g., most prescribed drug).
- In quality control to detect the most common defect or measurement.
Comparison Table
| Measure | Definition | Affected by Outliers? | Applicability in Pharmacy |
| Mean | Arithmetic average | Yes | Blood levels, dosage calculations |
| Median | Middle value | No | Survival analysis, ADR reporting |
| Mode | Most frequent value | No | Drug popularity, batch uniformity |
Why Central Tendency is Crucial in Pharmacy
In pharmaceutical sciences, these measures help in:
- Clinical Trials – Understanding the average response to a drug or treatment.
- Dosage Formulation – Ensuring the uniformity of weight or active ingredient in tablets or capsules.
- Adverse Drug Reaction Monitoring – Identifying patterns in side effects across patient groups.
- Bioavailability Studies – Comparing plasma concentration-time data using mean and median values.
- Pharmaceutical Sales and Marketing – Analyzing the most commonly sold dosage forms and brands (mode).
Conclusion
Mean, median, and mode are indispensable tools in pharmaceutical statistics. While each measure provides a central value for a dataset, their usage depends on the nature of the data and the objective of the analysis. The mean offers a balanced average for symmetric data, the median provides a robust central point for skewed distributions, and the mode reveals the most frequent occurrence, essential for categorical and manufacturing data. In pharmaceutical research and practice, understanding these measures ensures better decision-making, quality control, and ultimately, improved patient outcomes.